Urban Heat Mitigation
As a part of the Spring 2025 session of NASA DEVELOP, my team worked with the government of Chatham County, Georgia to map urban heat and identify priority mitigation areas within their jurisdiction. We used optical and infrared satellite imagery from Landsat 8 and 9 and the ISS, as well as National Land Cover Database imagery and social statistics provided by the Census Bureau.
I used the Valuation of Ecosystem Services and Tradeoffs (InVEST) Urban Cooling Model from the Natural Capital Project to create a heat mitigation index for the county. This index represents an area’s ability to cool itself via vegetation. We also created a heat vulnerability index to capture both social and environmental components of urban heat susceptibility.
See our report for this project here.
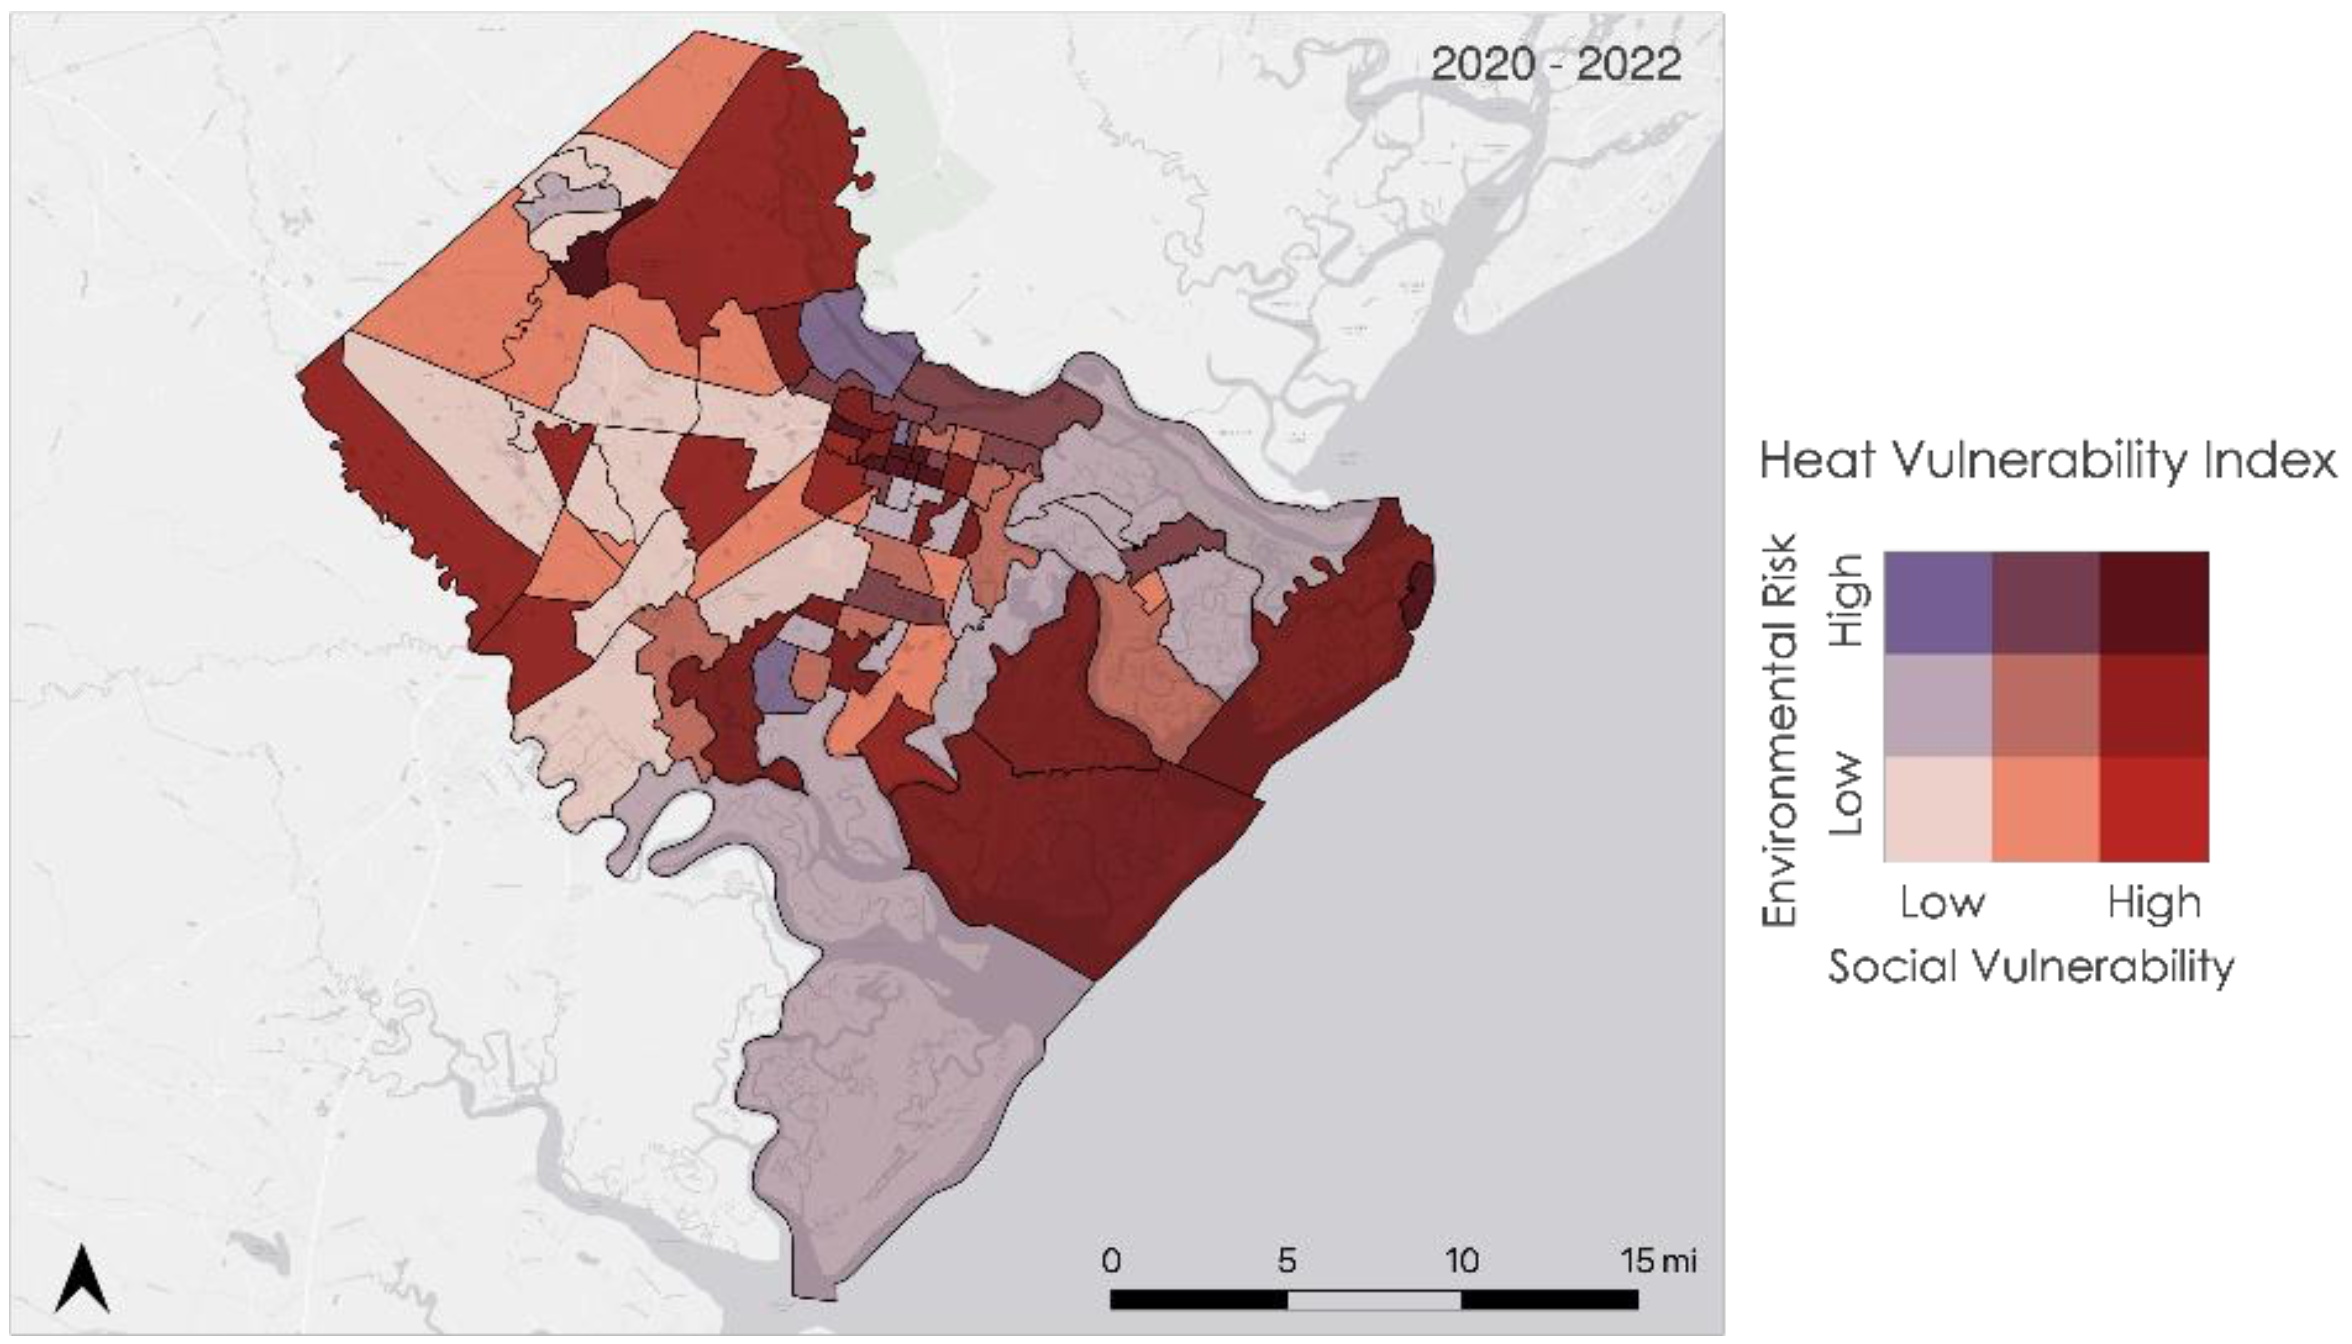
Bivariate Heat Vulnerability Index.
The Heat Vulnerability Index (HVI), displayed on a bivariate census tract map below, reveals the center of Savannah, as well as northern Pooler and Tybee Island, to show the greatest vulnerability to heat events.
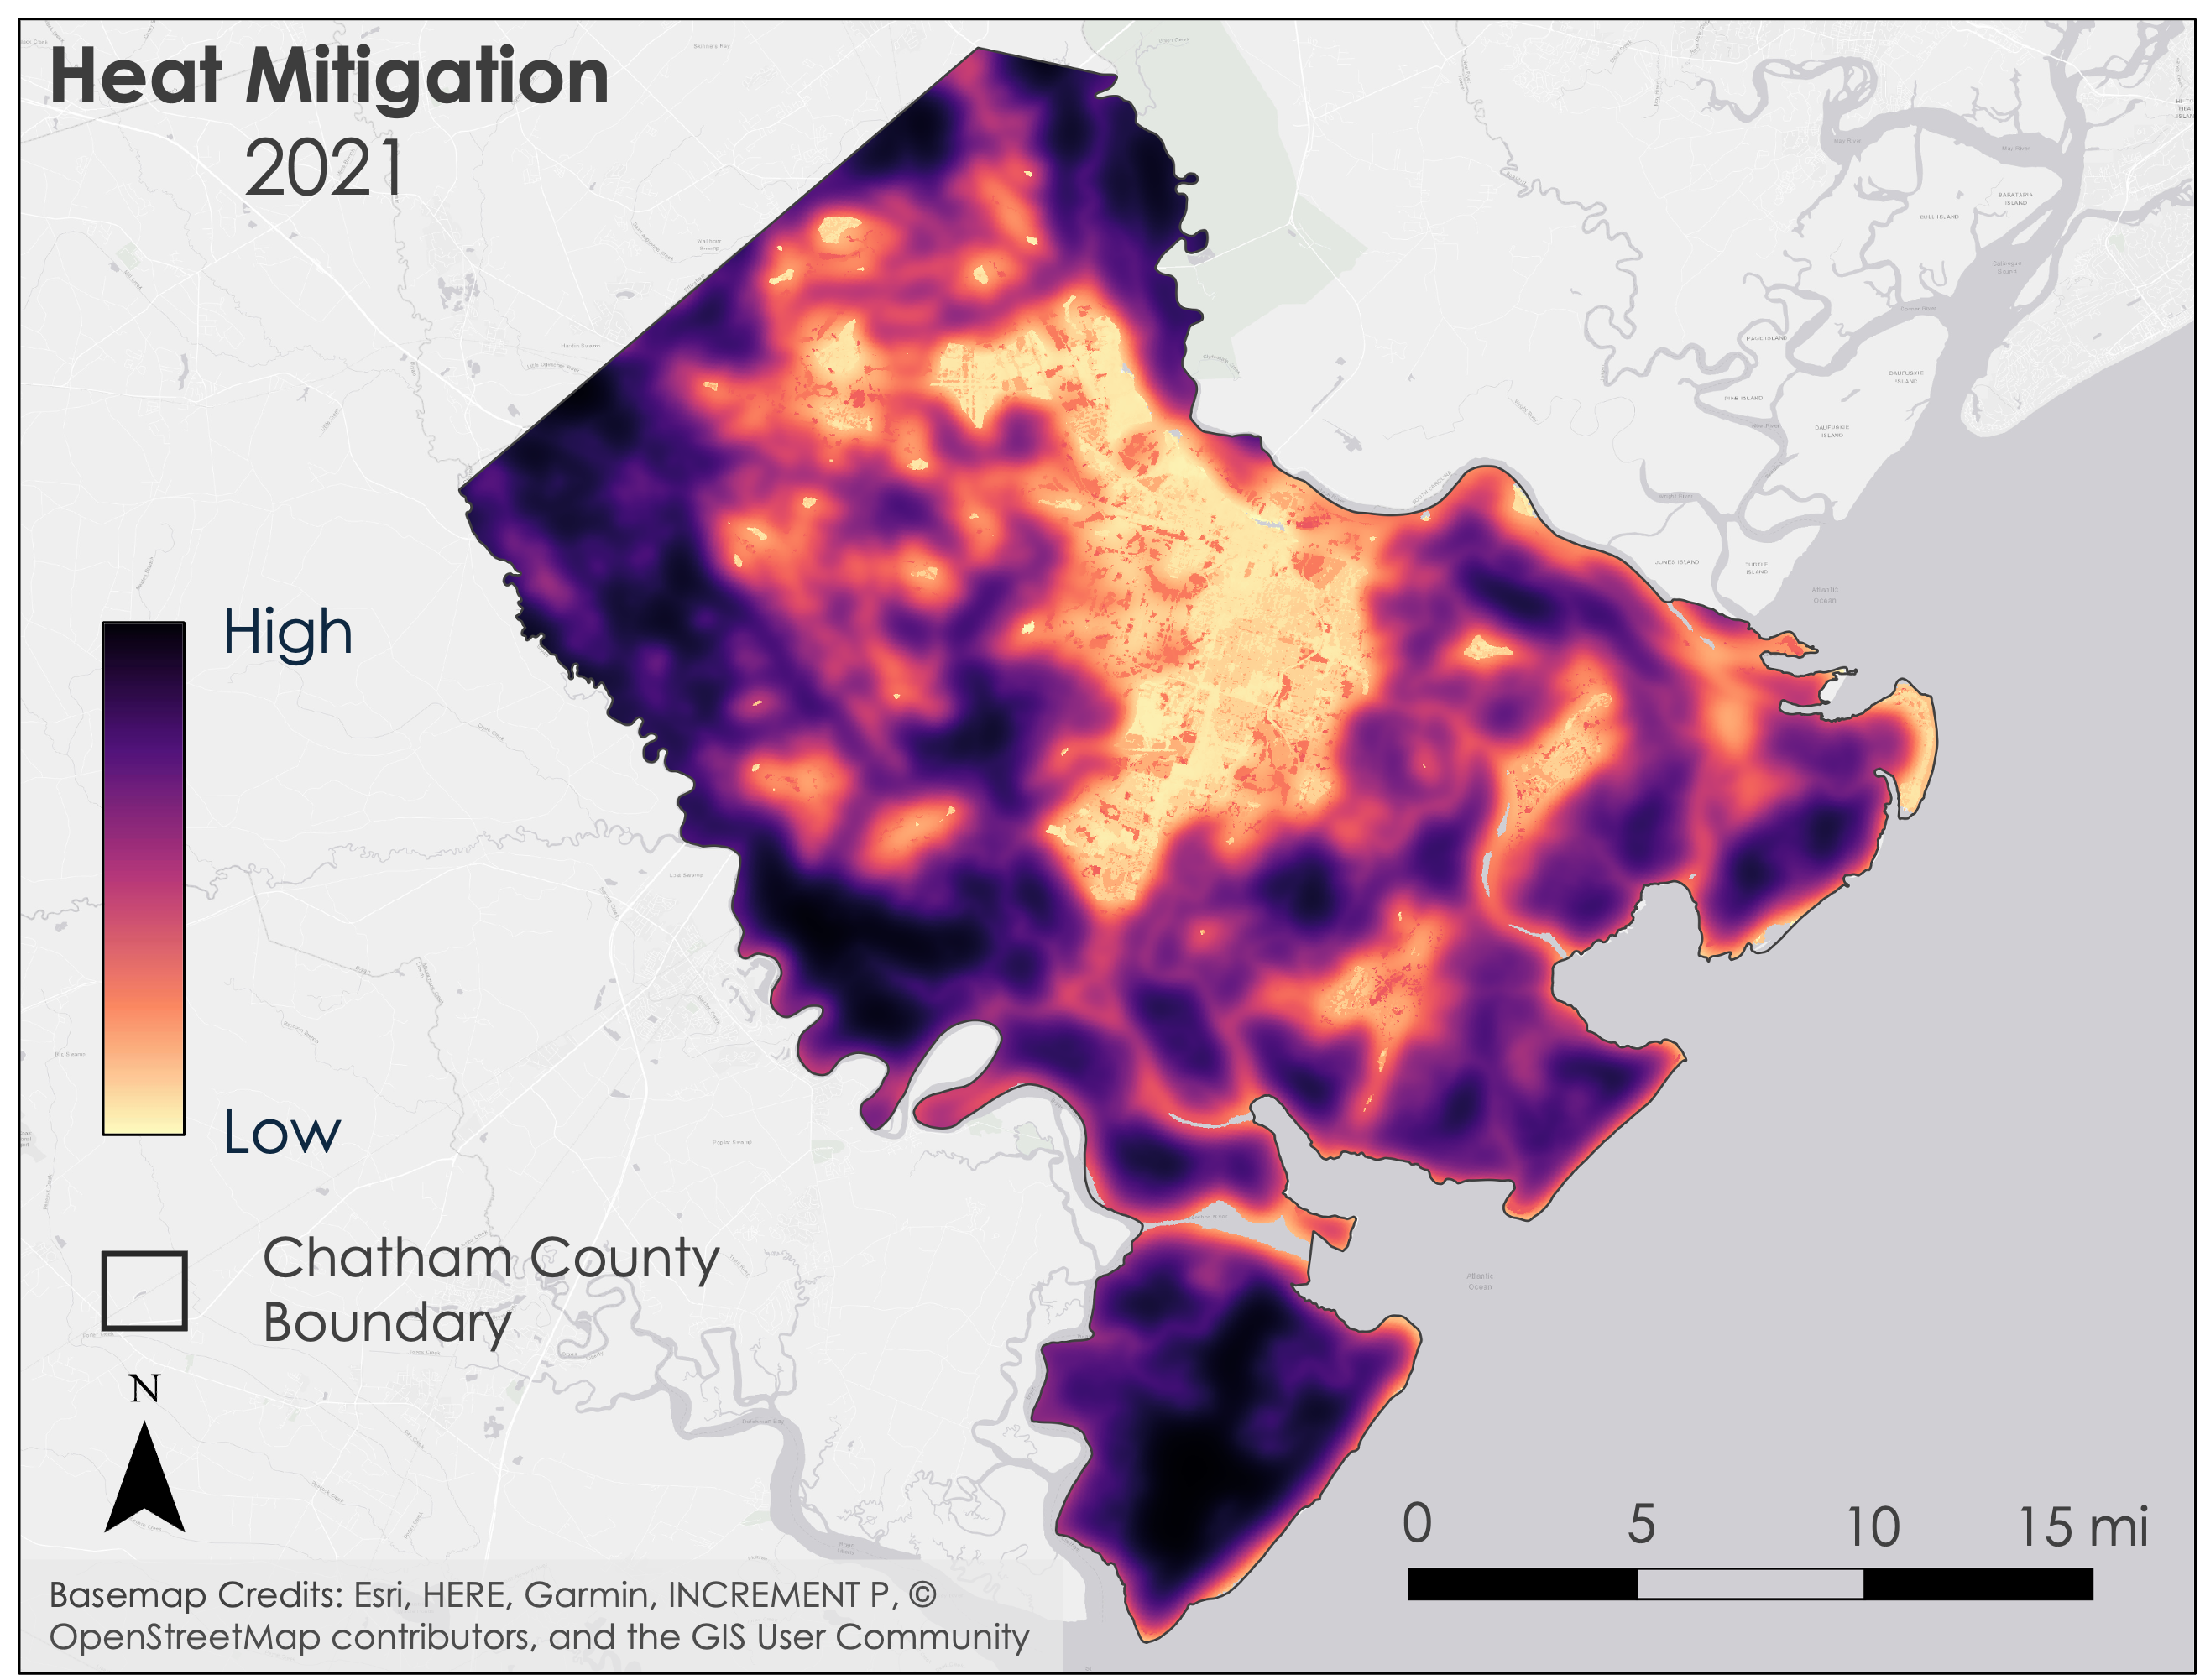
Heat Mitigation Index.
The heat mitigation index shows Savannah to have the lowest heat mitigation. Savannah experiences the urban heat island effeect due to the high concentration of urban surfaces, and the low concentration of vegetation and greenery. Other urban areas, including Garden City, Pooler, Port Wentworth, and Thunderbolt, also demonstrate low heat mitigation. Areas of high heat mitigation are seen on the borders of the county, where large green areas are found in abundance.